|
|
|
|
|
Survey at CeBIT
Our data collection effort focused on end users and business users, in the realm of mobile connectivity using the visitors to the CeBIT Exhibition held in Hannover during the Spring of 2002. A questionnaire was presented to each of these user categories. We were able to collect 58 responses to the end user questionnaire.
Generally, most visitors who were end-users, were interested in answering their questionnair. The majority of the participants were from EU countries, while the Asian participants were mainly from Japan and China.
This document shows the graphical representation of the data collected from the end-users and the analysis performed. The data was analyzed by using statistical methods with the help of the SPSS software. Frequencies and other descriptive statistics were calculated in order to get an overall picture of the data. Explorative factor analysis was used for extracting the user needs and traits. Analysis of variance (ANOVA) was used for comparing the means between different end user groups. Finally, correlations for finding connections between the factors were calculated.
Descriptive statistics of the data
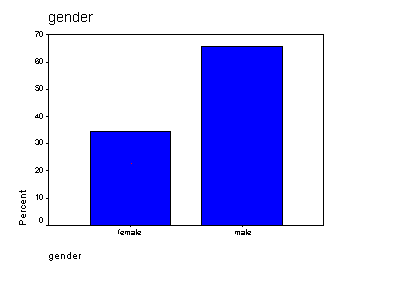
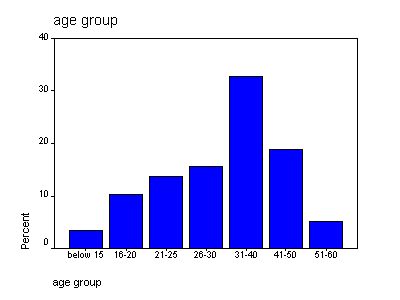
| Altogether, 58 persons filled the end user questionnaire at CeBIT. 34,5% of the respondents were female. The majority were males. | Most end users belonged to the '31-40 year' age category. Data collected on age groups are presented in the figure 'Age group'. | ||
|
|
||
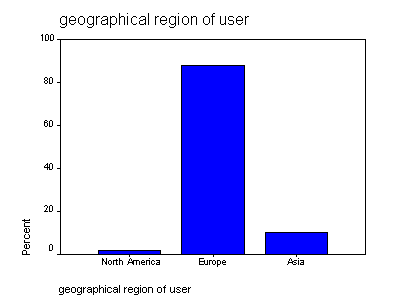
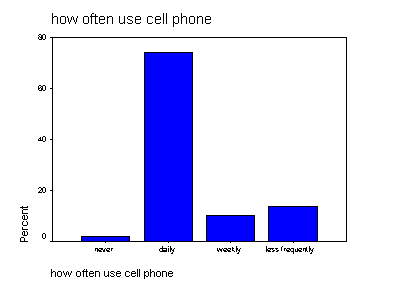
| Most end users were from Europe, which is acceptable in this case as the exhibition was held in Germany. This data, is presented in the 'Geographical Region of User' graph. | The end users seem to use the cell phone frequently. More than 70% uses the cell phone daily, and less than 20% uses it less frequently than weekly. | ||
|
|
||
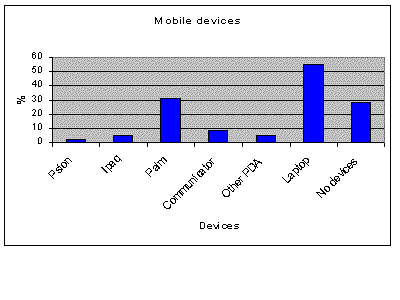
| The most popular mobile device (other than cell phones) among the end users, is the laptop; more than 50% of the end users, had one. Approximately 30% of the end users had a Palm. Other mobile devices are quite rare. It is noticeable however, that almost 30% had no mobile devices at all. | |||
|
An explorative factor analysis was performed and the Principal Axis Factoring method was used to extract the factors. Varimax rotation method was used for rotating the initial solution. Six factors with Eigenvalues >2 were extracted from the data. Reliability analysis was performed on the data, i.e. the Cronbach's alpha was calculated to the sum variables which were formed on the basis of the factors' contents. The sum variables were calculated for enabling further analysis on the data (e.g. means comparison, correlations between the factors). As a result of the factor analysis, a model of the user needs and traits of using the mobile IT devices was constructed.
The user needs and users' requirements are according to our analysis, which are mainly attached to:
According to the questionnaire data, there are six different use traits (ways to work with Mobile IT devices). These are the user requirements what can be concluded from the data gathered from the end users, relating to services envisioned by NOMAD. The factor analysis was used to extract these traits. The exact contents and reliability tests of each factor are presented in the link at the References.
Most users were concerned about the sucurity aspect of mobile devices & their applications. Following are the charachteristics of a 'simple to use' secure environment.
Technology and mobile IT devices are seen as an indicator of a modern lifestyle - so technology must be "cool". The users must have information regarding these different technologies (such as how fast it is, how efficient it is, how powerful it is).
It is important for the more advanced users to have a feeling that "I am using the latest technology".
Usability is an important issue, which means that if a service or a device is used daily, they must be available at all times, whenever a user requires their service.
If the technology involves complicated operations by the user, it becomes inconvenient.
This gives an interesting point of view to VASP - push advertisements to customers and give them an instant access to accept the deal.
One-way analysis of variance (ANOVA) was used for comparing the means of the sum variables formed on the basis of the factors. In this analysis the factor's means were compared in order to find out whether there were significant differences between the groups. The groups used in the comparison were formed by the following criteria: age group, gender, use of cell phone and geographic region. The significance level of 0.05 (at least) was used in this analysis. The result is that no significant differences were found in the means between any of the groups.
This indicates that, the end users form a rather uniform group with regard to the user needs and use traits.
Correlations were calculated for the factors (sum variables) in order to find out whether the factors were interrelated. Statistically significant (but rather low) correlations between the factors were found:
| Use Trait |
Privacy |
New Technology |
Lead User |
| Daily use of IT | .297 * |
.322 * | |
| Lead User |
.306 * |
.312 * |
|
| New Technology |
.392 ** |
* = significance level 0.05 : ** = significance level 0.01
This sections lists the links to the complete report of
this project, the questionnaire and the contents and reliability tests
of each factor.